• Skip to primary navigation
  • Skip to main content
  • Skip to primary sidebar

5 Circles Research

  • Overview
  • SurveysAlaCarte
  • Full Service
  • About
  • Pricing Gurus
  • Events
  • Blog
  • Contact

Pricing Gurus and 5 Circles Research Blog Posts

Van Westendorp pricing (the Price Sensitivity Meter)

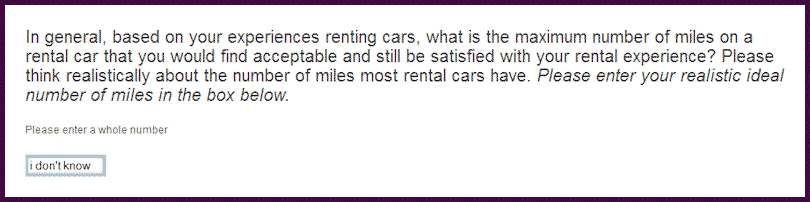
This is a follow up to classes I taught that included a short section on pricing research methodologies. I promised some more details on the Van Westendorp approach, in part because information available online may be confusing, or worse. This article is intended to be a practitioner’s guide for those conducting their own research.

First, a refresher. Van Westendorp’s Price Sensitivity Meter is one of a number of direct techniques to research pricing. Direct techniques assume that people have some understanding of what a product or service is worth, and therefore that it makes sense to ask explicitly about price. By contrast, indirect techniques, typically using conjoint or discrete choice analysis, combine the price with other attributes, ask questions about the total package, and then extract feelings about price from the results.

I prefer direct pricing techniques in most situations for several reasons:

  • I believe people can usually give realistic answers about price.
  • Indirect techniques are generally more expensive because of setup and analysis.
  • It is harder to explain the results of conjoint or discrete choice to managers or other stakeholders.
  • Direct techniques can be incorporated into qualitative studies in addition to their usual use in a survey.

Remember that all pricing research makes the assumption that people understand enough about the landscape to make valid comments. If someone doesn’t really have any idea about what they might be buying, the response won’t mean much regardless of whether the question is direct or the price is buried. Lack of knowledge presents challenges for radically new products. This aspect is one reason why pricing research should be treated as providing an input into pricing decisions, not a complete or absolute answer.

Other than Van Westendorp, the main direct pricing research methods are these:

  • Direct open-ended questioning (“How much would you pay for this”).  This is generally a bad way to ask, but you might get away with it at the end of a in-depth (qualitative) interview.
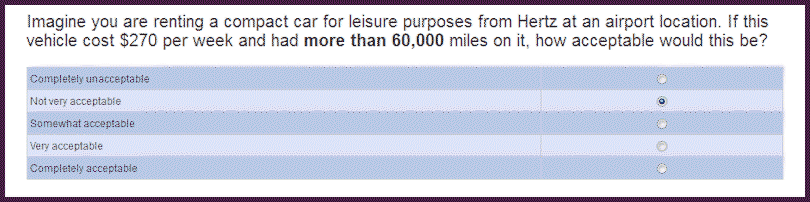
  • Monadic (“Would you be willing to buy at $10”). This method has some merits, including being able to create a demand curve with a large enough sample and multiple price points. But there are some problems, chief being the difficulty of choosing price points, particularly when the prospective purchaser’s view of value is wildly different from the vendor’s. Running a pilot might help, but you run the risk of having to throw away results from the pilot. But if you include open-ended questions for comments, and people tell you the suggested price is ridiculous, at least you’ll know why nobody wants to buy at the price you set in the pilot. Monadic questioning is pretty simple, but it is generally easy to do better without much extra work.
  • Laddering (“would you buy at $10”, then “would you buy at $8” or “would you still buy at $12”). Don’t even think about using this approach, as the results won’t tell you anything. The respondent will treat the series of questions as a negotiation rather than research. If you wanted to ask
    about different configurations the problem is even worse.
  • Van Westendorp’s Price Sensitivity Meter uses open-ended questions combining price and quality. Since there is an inherent assumption that price is a reflection of value or quality, the technique is not useful for a true luxury good (that is, when sales volume increases at higher prices). Peter Van Westendorp introduced the Price Sensitivity Meter in 1976 and it has been widely used since then throughout the market research industry.

How to set up and analyze using Van Westendorp questions

The actual text typically varies with the product or service being tested, but usually the questions are worded like this:

  • At what price would you think product is a bargain – a great buy for the money
  • At what price would you begin to think product is getting expensive, but you still might consider it?
  • At what price would you begin to think product is too expensive to consider?
  • At what price would you begin to think product is so inexpensive that you would question the quality and not consider it?

There is debate over the order of questions, so you should probably just choose the order that feels right to you. We prefer the order shown above.

The questions can be asked in-person, by telephone, on paper or (most frequently these days) online survey. In the absence of a human administrator who can assure comprehension and valid results, online or paper surveys require well-written instructions. You may want to emphasize that the questions are different and highlight the differences. Some researchers use validation to force the respondent to create the expected relationships between the various values, but if done incorrectly this can backfire (see my earlier post). If you can’t validate in real-time (some survey tools won’t support the necessary programming), then you’ll need to clean the data (eliminate inconsistent responses) before analyzing. Whether you validate or not, remember that the questions use open-ended numeric responses. Don’t make the mistake of imposing your view of the world by offering ranges.

Excel formulae make it easy to do the checking, but to simplify things for an eyeball check, make sure the questions are ordered in your spreadsheet as you would expect prices to be ranked, that is Too Cheap, Bargain, Getting Expensive, Too Expensive.

Ensure that the values are numeric (you did set up your survey tool to store values rather than text didn’t you? – if not another Excel manipulation is needed), and then create your formula like this:

IF(AND(TooCheap<=Bargain,Bargain<=GettingExpensive, GettingExpensive<=TooExpensive), OK, FAIL)

You should end up with something like this extract:

ID

Too Cheap

Bargain

GettingExpensive

TooExpensive

Valid

1

40

100

500

500

OK

2

1

99

100

500

OK

3

10

2000

70000

100

FAIL

4

0

30

100

150

OK

5

0

500

1000

1000

OK

Perhaps respondent 3 didn’t understand the wording of the questions, or perhaps (s)he didn’t want to give a useful response.  Either way, the results can’t be used.  If the survey had used real-time validation, the problem would have been avoided, but we might also have run the risk of annoying someone and causing them to terminate, potentially losing other useful data.  That’s not always an easy decision when you have limited sample available.

Now you need to analyze the valid data.  Van Westendorp results are displayed graphically for analysis, using plots of cumulative percentages. One way is using Excel’s Histogram tool to generate the values for the plots. You’ll need to set up the buckets,so it might be worth rank ordering the responses to get a good idea of the right buckets.  Or you might already have an idea of price increments that make sense.

Create your own buckets, otherwise the Excel Histogram tool will make its own from the data, but they won’t be helpful.

Just to make the process even more complicated, you will need to plot inverse cumulative distributions (1 minus the number from the Histogram tool) for two of the questions. Bargain is inverted to become “Not a Bargain” and Getting Expensive becomes “Not Expensive”.  Warning: if you search online you may find that plots vary, particularly in which questions are flipped. What I’m telling you here is my approach which seems to be the most common, and is also consistent with the Wikipedia article, but the final cross check is the vocalizing test, which we’ll get to shortly.

Van Westendorp example chart

Before we get to interpretation, let’s apply the vocalization test.  Read some of the results from the plots to see if everything makes sense intuitively.

“At $10, only 12% think the product is NOT a bargain, and at $26, 90% think it is NOT a bargain.”

“44% think it is too cheap at $5, but at $19 only 5% think it is too cheap.”

“At $30, 62% think it is too expensive, while 31% think it is NOT expensive – meaning 69% think it is getting expensve” (Remember these are cumulative – the 69% includes the 62%). Maybe this last one isn’t a good example of the vocalization check as you have to revert back to the non flipped version. But it is still a good check; more people will perceive something as getting expensive than too expensive.

Interpretation

Much has been written on interpreting the different intersections and the relationships between intersections of Van Westendorp plots. Personally, I think the most useful result is the Range of Acceptable Prices.   The lower bound is the intersection of Too Cheap and Expensive (sometimes called the point of marginal cheapness).  The upper bound is the intersection of Too Expensive and Not Expensive (the point of marginal expensiveness).  In the chart above, this range is from $10 to $25.  As you can see, there is a very significant perception shift below $10.  The size of the shift is partly accounted for by the fact that $10 is an even value.  People believe that $9.99 is very different from $10; even though this chart used whole dollar numbers, this effect is still apparent.  Although the upper intersection is at $25, the Too Expensive and Not Expensive lines don’t diverge much until $30.  In this case, anywhere between $25 and $30 for the upper bound would probably make little difference – at least before testing demand.

Some people think the so-called optimal price (the intersection of Too Expensive and Too Cheap) is useful, but I think there is a danger of trying to create static perfection in a dynamic world, especially since pricing research is generally only one input to a pricing decision. For more on the overall discipline of pricing, Thomas Nagle’s book is a great source.

Going beyond Van Westendorp’s original questions

As originally proposed, the Van Westendorp questions provide no information about willingness to purchase, and thus nothing about expected revenue or margin.

To provide more insight into demand and profit, we can add one or two more questions.

The simple approach is to add a single question along the following lines:

At a price between the price you identified as ‘a bargain’ and the price you said was ‘getting expensive’, how likely would you be to purchase?

With a single question, we’d generally use a Likert scale response (Very unlikely, Unlikely, Unsure, Likely, Very Likely) and apply a model to generate an expected purchase likelihood at each point. The model will probably vary by product and situation, but let’s say 70% of Very Likely + 50% of Likely as a starting point. It is generally better to be conservative and assume that fewer will actually buy than tell you they will, but there is no harm in using what-ifs to plan in case of a runaway success, especially if there is a manufacturing impact.

A more comprehensive approach is to ask separate questions for the ‘bargain’ and ‘getting expensive’ prices, in this case using percentage responses.  The resulting data can be turned into demand/revenue curves, again based on modeled assumptions or what-ifs for the specific situation.

Conclusion

Van Westendorp pricing questions offer a simple, yet powerful way to incorporate price perceptions into pricing decisions.  In addition to their use in large scale surveys described here, I’ve used these questions for in-depth interviews and focus groups (individual responses followed by group discussion).

Idiosyncratically,

Mike Pritchard

References:

Wikipedia article: http://en.wikipedia.org/wiki/Van_Westendorp’s_Price_Sensitivity_Meter

The Strategy and Tactics of Pricing, Thomas Nagle, John Hogan, Joseph Zale, is the standard pricing reference. The fifth edition contains a new chapter on price implementation and several updated examples on pricing challenges in today’s markets.

Or you can buy an older edition to save money. Search for Thomas Nagle pricing

Pricing with Confidence, Reed Holden.

The Price Advantage, Walter Baker, Michael Marn, Craig Zawada.

Van-Westendorp PH,(1976), NSS Price Sensitivity Meter – a new approach to the study of consumer perception of price. Proceedings of the 29th Congress, Venice ESOMAR

Filed Under: Featured Posts, Methodology, Pricing Tagged With: pricing, Van Westendorp

Customer satisfaction: little things can make a big difference

Unfulfilled promises by the dealer and Toyota of America deepen customer satisfaction pothole

Toyota of America and my local dealer could learn a few simple lessons about vehicle and customer service.

  1. When a customer asks for a simple improvement to service procedures, let the customer know you’ll do better in future. Thank the customer for the suggestion.
  2. Respond quickly, and comply with time commitments whether made by the dealer or the manufacturer.
  3. Don’t blame delays on communications issues or whether the dealer (who does the work) or the manufacturer (who receives the feedback) is responsible. The customer doesn’t care.

The full story

I received a follow-up survey from Toyota of America after the local dealer serviced my Toyota Sienna.  The survey was pretty good (I’d probably score it 8 or 9 out of 10 for user experience and gathering satisfaction information). They sent two reminders after the original invitation which is good practice. This article isn’t really a survey evaluation, but rather to show how the follow-up was mishandled with the result being to lower my customer satisfaction.

It’s probably best if I explain what my issue was so that you can read the rest of the article with that in mind. I didn’t realize what had happened until a few days later when I attended a meeting in Seattle that started early evening. It was dark by the time I started driving home, and as I was about to enter the freeway on-ramp, I noticed someone behind me flashing their lights at me. I don’t know if it was just luck that I spotted the flashing and immediately checked; discovering that my headlights were off, I turned them on immediately. I always leave headlights on the automatic setting (in fact having automatic headlights is one thing I look for in a new vehicle), so it was pretty obvious to me that the setting had been changed during the service. It was pretty annoying, and Toyota Dealer
I considered myself lucky not to have been pulled over by the police that evening. Worse, I had actually been pulled over by the police a few months earlier not long after the previous service while driving in a different city. The policeman was very nice and even suggested that the issue might have been caused by the mechanic who did the service.

The policeman suggested that the issue might have been caused by the mechanic who did the service.

I bear part of the responsibility for not following up after the first incident, and I guess also for not remembering after the subsequent service. However, I think the majority of the blame should be directed to the service organization. Later I noticed one other setting change that I believe was the result of the service, but I wasn’t 100% certain. We’d been going through a period of poor air quality locally; I followed advice to change air conditioning to “recirculate”. This was less impactful to me personally than the light setting, but could have been more of a concern to people who are more susceptible to poor air quality.

Before I move on to the post-service saga, I’ll comment on a couple of things in the survey that got in the way of me being able to communicate my issue and ask for follow-up.

  • The key question about satisfaction with various aspects of the service was presented as a 10 point radio button matrix anchored with “Unacceptable 🙁“, “Average”, and “Truly Exceptional 🙂“. That’s a fine treatment, and I was glad to see that they didn’t use Net Promoter Score.
  • I couldn’t see an attribute that closely matched what I wanted to explain, so I ended up giving a lower rating for the Quality of Work attribute [expanded as “thoroughness of work done on your vehicle, fixing vehicle right the first time (leave blank if not applicable)”]. My issue was about the state of the vehicle after the service. That certainly relates to what the people working on the vehicle do, but it doesn’t relate to my perceptions. I half expected the low score I gave to generate a follow-up question immediately to ask me why; there wasn’t a follow-up.
  • I think they also missed an opportunity on that question – or elsewhere in the survey – to state that I could later expand on any issue if I wished.
At the end of the survey, there was a thank you page which included information about how to contact the dealer and a link and phone number for the Toyota Customer Experience Center.
Honda Insight interior
Yes, that’s a Honda – I doubt if Toyota dealers are the only offenders.

That’s what I was hoping for. I chose the topic “Dealership Service Experience”, and in the open-ended box I explained why was unhappy, and that the proper solution would be for the service technician to note the settings and return them to the way they were when the vehicle. With the complexity of vehicles these days, owners shouldn’t have to repeat what they went through when they first acquired the car.

With the complexity of vehicles these days, owners shouldn’t have to repeat what they went through when they first acquired the car.

After submitting the survey, I received an automated follow-up immediately from Toyota of America promising a “tailored response as quickly as possible”. I like the tone of this phrase because it doesn’t promise too much. If they had stated that the response would be within a certain period of time I would have expected some follow-up within the stated time-frame even if Toyota did not yet have a complete answer.

The series of emails from Toyota of America and the dealer was quite a saga, lasting 43 days from when I first filled out the post-service survey. I’ll spare you most of the details and summarize the key points here.
  • Toyota of America responded within a couple of days asking for my permission to contact the dealer, explaining that each dealer has a customer relations manager whose job is to address all service issues.
  • Toyota of America gave me two dates for when the dealer would contact me. Neither commitment was kept.
  • Toyota of America told me that they were unable to act as an intermediary or force the dealer into any action.
  • The dealer finally emailed me stating that “in a recent department meeting it was stressed that guests settings should be returned to the original settings“, and telling me that they continue to strive for excellence so that I will want to return again and again to the dealer.

The response from the dealer was exactly what I’d asked for in the first place. However, this experience was not a shining example of how to improve customer satisfaction.

  • Why did it take so long for the dealer to get back to me?
  • Why were the commitments not kept, and what was going on between the manufacturer and the dealer? It seems absurd that Toyota of America would write that they were not acting as an intermediary when that’s exactly what they were doing. And, to say that they can’t force the dealer into action is also not reflective of the reality of the relationship.
  • I realize that my negative reaction to the word “guest” is somewhat pointless and I didn’t share my opinion with either Toyota of America or the dealer, but I will say something here. Hotels and Disney started the change, and try to live up to their interpretation. The additional meaning of someone who pays for the services of an establishment such as a hotel or restaurant is now entrenched.  But it’s irritating. Just treat me as a customer please.

Aftermath

I waited to publish this until after the next service so that I would be able to see if the dealer had changed their procedures. This time, the light switch was set as I had left it — on automatic — so that was a positive change. However, it appeared that something had changed with the audio settings, and that it was most likely due to removing the battery to test it which was part of this scheduled service. I’m not certain if my interpretation is accurate, but it would have been good customer service to remind me to check settings if battery removal was part of the service.

More troubling was an email I received from the service advisor a couple of days after the service.

“You may receive an email survey from Toyota National about your recent visit. This survey is my personal report card and is very important to me. It would be greatly appreciated if you could take a moment to fill it out. Anything less than 10’s, yes’s, and truly exceptional in all areas is considered a failing score by our standards. If for any reason I have not met these standards please feel free to contact me or my service manager.”

I’ve experienced higher pressure communications from employees of other companies, but statements that emphasize the desire for high scores rather than requesting honest feedback are not consistent with maintaining or improving high customer satisfaction.  More on this in another article; for now let’s just say “don’t do this!”.

Idiosyncratically,

Mike Pritchard


Filed Under: Customer Satisfaction, Featured Posts

Are you pricing based on cost rather than value? Why?

At Pricing Gurus, we believe that value-based pricing allows companies to achieve higher profitability and a better competitive position. Some companies disagree with that perspective, or feel they are stuck with cost-based pricing. Let’s explore a few reasons why value-based pricing is generally superior.

I like this definition from Wikipedia – “Value-based price is a pricing strategy which sets prices primarily, but not exclusively, according to the perceived or estimated value of a product or service to the customer rather than according to the cost of the product or historical prices”, and also the next sentence that describes the reason for choosing this approach –“Where it is successfully used, it will improve profitability through generating higher prices without impacting greatly on sales volumes.”

Defining value is not always easy, especially without asking customers and prospects. The old notion that people buy a hole rather than a drill bit still applies. Prospects consider your product or service because of what it can do for them, rather than the elements that make up cost, such as materials and labor. Value is most clearly seen when the product or service is differentiated. When all suppliers offer essentially the same thing, that’s a commodity market which leads to competing solely based on price. Suppliers can try to reduce costs, or distinguish themselves based on – for example – customer service, but that’s a fragile situation when alternatives can provide the same capability.

How loyal are you to the brand of gas you buy? Most people treat gasoline as a commodity. They might pay a little more for using a gas station near home (or a lot more for filling up where there is little competition), but generally price is a major factor. That’s a commodity.

Setting prices based on time and materials appears safer for the seller, but there are more unknowns for buyers (who might feel cheated if they have to pay for an obstacle that suddenly appears). This situation might occur when there are true unknowns (such as remodeling contractor not knowing what they’ll find behind a wall), or perhaps the seller (supplier) is inexperienced. More experienced suppliers are better able to use value-based pricing because they know that some jobs will be more profitable than others which allows them to predict average cost. Good contract language can minimize risks arising from unknowns or customers who withhold information.

Making Apple products requires state-of-the-art machines and lots of people who know how to run them.

Tim Cook
Cost-based pricing can penalize the seller (and indirectly the buyer) by discouraging investment in equipment, employee training or hiring better employees. Why change if you are rewarded for inefficiency? Yet these kinds of investments can increase revenues profitably by supporting higher volume, improve competitive position through higher-quality, and create more flexibility for lowering prices when necessary. An article in the New York Times describes how US companies’ inability to produce the right type of screw is a significant reason for Apple keeping production in China. Lack of investment reduced competitiveness for US companies.

Setting prices based on value means more effort for the supplier, but it’s worth it. Challenge salespeople who tell you that price is the major barrier; research shows that sellers believe price is more important than buyers do. Perhaps some of your most price-sensitive customers are also those who make unreasonable demands, and you’d be better off without them.

Companies can’t always use value-based pricing, or at least with all customers. Government entities often try to force suppliers to behave as if their products are commodities. That’s not always true, such as when price is only one of several things scored in a proposal. And you don’t have to use the same approach for all your customers.

Value-based pricing tends to lead to higher customer satisfaction, better relationships between supplier and customer, and more repeat business.  We’ve touched on a few things in this article – for more information including how to ask prospects about pricing, check out the rest of the Pricing Gurus site.

If you aren’t using value-based pricing now, isn’t it time to consider it?

Mike Pritchard, Pricing Gurus, mikep@pricinggurus.com

References:

https://en.wikipedia.org/wiki/Value-based_pricing

https://www.nytimes.com/2019/01/28/technology/iphones-apple-china-made.html

Filed Under: Featured Posts, Pricing

Dutch ovens: paying a lot more means better value

An article on Dutch ovens in the September/October 2018 of Cook’s Illustrated gives food for thought (pun intended) about the relationship of between price and value. Sometimes higher value for a buyer means paying a lot more money – good news for the seller too.

Dutch ovens (also known as casseroles or cocottes) are multipurpose, with uses ranging from stews to baking. I must admit that reading the article made me realize I’m not exploring all the uses of mine so I’ll probably expand my repertoire.

All the ten models tested were similar in style – large, heavy, round, with a heavy lid and all holding about the same volume. Eight were enameled cast iron, one was uncoated cast iron, and one was ceramic. I don’t want to go into much detail about Cook’s Illustrated‘s perspective on appropriate features and benefits, although I’ll make a couple of comments at the end of the article. The two highest rated products are sufficiently similar in most areas, with significantly different prices, to allow the products to illustrate my points about value well.

Let me be clear. Cook’s Illustrated did not explicitly rate value in their testing and review. In fact, the word “value” does not appear in the article at all.  However, the term “Best Buy” is used only for the #2 product (the Cuisinart Chef’s Classic Enameled Cast Iron Covered Casserole) which is the top of the list of Recommended Dutch Ovens. The only product classified as Highly Recommended is the Le Creuset 7 ¼ Quart Round Dutch Oven which received a perfect score, but costs $367.99 versus $83.70 for the Cuisinart at the time the article was published.

 Le Creuset Dutch oven Cuisinart Round Covered Casserole
Le Creuset $367.99
Cuisinart $83.70
Cooking ✮✮✮ Ease Of Use ✮✮✮ Durability ✮✮✮
Cooking ✮✮✮ Ease Of Use ✮✮1/2 Durability ✮✮1/2

That’s a huge price difference – over four times as much for the Le Creuset.  The next most expensive is the Staub at $279.99 which is rated a little lower than the Cuisinart. So why do people buy Le Creuset? And how does the opinion of customers and prospects affect how a product is priced?

The impact of brand can’t be ignored

Le Creuset was founded in 1925 and has been making enameled cast-iron since the beginning.  While they have introduced more colors since then, the distinctive flame color is owned by Le Creuset who has kept their focus on enameled cast iron with only a few products in other cooking areas. “Wedded” is a good word to describe the connection as Le Creuset is sometimes written into divorce agreements, and often the cookware is bequeathed to the next generation. Although Julia Child died nearly 20 years ago, she lives on through cookbooks and reruns. Images of Julia’s kitchen show more copper than enameled cast iron, and she wrote “copper pans are the most satisfactory of all to cook with, as they hold and spread the heat well, and their tin lining does not discolor foods.” However, she was also aware of the downsides of copper cookware, particularly lower end products. She also wrote. “With the exception of heavy copper, the best all-purpose material, in our opinion, is heavy, enameled cast iron”. Julia Child is indelibly associated with French cooking, and Le Creuset’s heritage is consistent with that association.

Cuisinart is no new kid on the block either, having been founded in 1971. Memories of how the company got started by creating a new category – the food processor – are less important to younger generations because of Cuisinart’s ongoing product line expansions. Cuisinart added other electrical kitchen devices fairly early, and then expanded into cookware in the late 1990s.  Those changes mean that the association with enameled cast iron is weaker than Le Creuset’s. Additionally, Cuisinart has been through ups and downs including bankruptcy and acquisition so those considering a Cuisinart product might be nervous about purchasing something that has accessories or if spare parts are needed . Although the name Cuisinart sounds vaguely French, the company is probably better known as an innovator than for a  connection with the heritage of French cooking. There has also been little consistency in pricing policies over the years which means that the potential purchaser can be confused about Cuisinart’s positioning.

Ease of use

Cook’s Illustrated is probably using a weighting system to combine their 6 point scales, and they may be using some hidden ratings as well. I don’t want to be too critical of the magazine’s testing and reviews (it’s one of my favorite publications and I learn from each edition), but something beyond the published scores must be used otherwise Crock-Pot’s Dutch oven (with the same total score and priced a little lower than Cuisinart) would probably have been a Best Buy. Cook’s Illustrated favored more comfortable handles, products that weighed less and were shallower, and also light interiors as being better for browning (although they also recognized the value of darker interiors for bread making).

I think that reviews are helpful for people to understand the issues involved in ease of use, to assess what’s important to them, and perhaps to narrow down their choices before visiting a store. Or they may consider some things soon after buying and be prepared to return an online purchase. I don’t find Le Creuset’s ½ star higher rating sufficient reason alone to reject Cuisinart’s lower priced product. But how good the ease of use is for a particular purchaser can be determined fairly quickly.

Durability

The lower durability rating for Cuisinart, my personal experience, and the promise inherent in the Le Creuset brand are what caused me to think about value, and to discuss what it means in terms of these products. I’m a value shopper who will spend more to get a product that will do a better job for me if it makes sense. Pricing Gurus researches pricing and teaches value-based pricing along with other pricing strategies.

To me, and presumably tens of thousands of Le Creuset owners, durability is important. Perhaps it’s just the brand promise but I don’t think so. I own only a few Le Creuset pieces (and I grit my teeth every time I buy a new one because of the price).  None of them is under 15 years old, and I’ve never had to throw one out.

The oldest piece I own, coincidentally, is a variant of the Dutch ovens tested by Cook’s Illustrated – an oval 5 ½ quart enameled cast iron Dutch oven. It’s over 25 years old and still going strong. It’s a little discolored inside, perhaps because I’m not cleaning it properly, but it’s an essential part of my “batterie de cuisine” as Julia might say – something I use often, and more frequently in the cooler months. Lower durability scores in the reviews weren’t just predictions. “But the Le Creuset held up better to the kind of everyday wear and tear not covered in the warranty; the Cuisinart pot chipped during our durability tests, while our winner emerged from testing looking as good as new.”

To turn that comment into something more concrete, I calculated price per year based on the current life of my 25 year old Dutch oven (which I fully expect to last many more years) and an estimated 5 year life for the Cuisinart. The price per year of useful life for the Cuisinart is 14% higher than the Le Creuset (assuming that the Le Creuset stops being functional immediately).  To put it another way, a Le Creuset Dutch Oven that lasts for 25 years is better value than a Cuisinart lasting 5 years and 8 months.

A Le Creuset Dutch Oven that lasts for 25 years is better value than paying less than one-fourth for a Cuisinart lasting 5 years and 8 months.

I’m a fan of Cuisinart too, although having replaced a food processor and a coffee maker it’s no surprise to read that Cook’s Illustrated’s experience with chips corresponds with my expectation for shorter lifespan.
There are at least two or three target segments for cookware that can be identified with durability preferences relevant to purchasers.

  • Those who place greater importance on long life in cookware and can afford to buy an expensive product. They may be drawn to tradition and avoid what they see as potential fads.
  • Those who are more interested in “good enough” and are less interested in having the best. They may be drawn to innovation and think that if something isn’t likely to last as long as traditional options by the time it breaks there will be better products available, or they may prefer to have new things frequently.
  • Those who would like “the best” but who are limited by budget. Some will buy one or two expensive products (or acquire them as a wedding gift for example). Others will want or need more items.

Lessons for manufacturers

  • Incorporate value into your products and pricing. Look at dimensions of value beyond product features.
  • Be consistent in positioning product lines. Should Le Creuset introduce a new low-priced product line? Probably not, at least not unless it comes from a different brand (perhaps a sub-brand) so as not to confuse people.

What could Cook’s Illustrated do better?

  • Help readers understand what products they need, and what size. The Dutch ovens tested are for recipes feeding 7 to 8 people. It’s OK to test that size, but some reference to smaller (less expensive) sizes suitable for smaller households would be helpful.
  • Stating that a product got chipped during testing is helpful; it would be great if you could tell people roughly how long they could expect it to last. Including durability in a value rating would also be useful. In the introduction page for Cook’s Illustrated buying guides, the first sentence is “We think that cookware ought to be made to last.” Perhaps that philosophy is a little more hidden than it should be. [Update March 6, 2020. Cook’s Illustrated appears to have updated this review, and also incorporated some additional text in related reviews for smaller Dutch Ovens describing more details of their durability testing.]
  • Prices have already changed quite a bit for some of the reviewed products since the article was published. That’s not all that surprising, and it might be good to let your readers know the rough timing of sales and the best places to buy for things that change price much. I don’t know what was behind this specific drop, but Le Creuset recently put a smaller Dutch oven (2-3 portions) on sale for 40% off.

Writing about cookware is making me hungry.  It’s time to get some dinner – perhaps reheating something I cooked in a Le Creuset pan and froze.  Then maybe I’ll check out the Chicken Vesuvius recipe in the same issue of Cook’s Illustrated.

Idiosyncratically,

Pricing Guru Mike (Mike Pritchard)

Filed Under: Featured Posts, Pricing

Methow Valley Ski Trails gets pricing right

The Methow Valley is a remote area in Eastern Washington State. It’s a destination recreation area year-round, and even more so in the winter when the North Cascades Highway is closed making a circular drive impossible.

cross-country skiers on Methow Valley trailsI’ve enjoyed skiing the trails in the Methow Valley on a number of occasions, and on a recent visit I was struck by how much the Methow Trails organization has done to encourage usage among visitors and residents, particularly through pricing and moving with the times. The organization and local businesses understand the economic impact of maintaining a well-developed groomed trail system. The tagline “North America’s largest cross-country ski trail system” is a good fit considering there are 200 km of groomed trails.

The Methow Valley Trails Organization’s pricing offers a number of insights for pricing both services and products.

Discounted pricing for multiple days increases commitment, encourages longer stays, and brings more revenue to local businesses. A day pass costs $24 and a three day pass costs $60. That’s a 17% discount, with additional days at $20 enjoying the same discount. This approach of discounting for multi-day passes is fairly common at destination ski resorts. It doesn’t conform to the suggestions in my post about temporary discounts (buyers misunderstand discounts) but the motivation is different in this case. The Methow Trails organization wants to encourage people to stay longer in the area. Beyond the financial incentive, a three day pass is more convenient. You only have to visit a retailer once to pick up your pass.

older cross-country skiers on Methow Valley trailsDifferentiated pricing by age. Most Nordic ski centers offer discounts for children or seniors. Methow Trails is unusual in allowing those 17 or under to ski free. Other places tend to limit free skiing to young children (e.g. 5 or under); this of course goes some way to overcome concerns about a small child who gets fed up with skiing during the day. Those over 75 ski free in the Methow Valley, however there is no discount at the usual ages of 62 or 65. I believe the reasoning for the higher age limit may relate to my experience skiing in Germany years ago. I thought I was doing pretty well until several fit skiers in their 70s passed me with ease. I don’t get to ski free yet, but I hope that keeping active in general and continuing to cross-country ski in particular will enhance my later years.

Season passes provide cash flow stability and other benefits. Ski centers usually offer season passes. A number of factors are involved in setting the price for a season pass, including providing a discount in exchange for the cash stability resulting from selling ahead. Convenience is relevant too, as a season pass eliminates the time to pick up a pass for each trip. At $325 for the season, buying a season pass comes out ahead of multi-day passes after 5 three-day trips (or fewer if each trip is longer – likely to be the case for many Methow Valley visitors). There’s a little bit of risk involved for both buyer and seller. The uncertainties of the snow pack (with increasingly more impact from climate change) affect both the cost of grooming and decisions by visitors. From my visits to the Methow Valley, variability in the snow pack is a big factor in numbers on the trails. However, the increase from 6,300 visitor ski days for the 1983-1984 season to 40,000 for 2003-2004 is more likely to be driven by promotion than weather. Considering how your products and services can thrive amidst great variability of external factors is relevant to many companies as they set prices.

Freemium pricing. Even if you’re not interested in cross-country skiing or other winter sports, pay particular attention to this facet of the Methow Valley ski pass pricing. The Big Valley trails (7.7 km total) and a short trail not far from the hotels and restaurants in Winthrop are completely free. The signs at trailheads identify the cost, presumably allocated from overall funds including individual passes, business membership (i.e. support in exchange for promotion), and contributions from various public and non-profit sources. Free trails encourage people to try cross country skiing, and may increase the number of people coming to the Methow Valley (“come with us – there is plenty to do, and you don’t have to buy a pass to try“). Of course, a newbie is likely to need to rent equipment, nevertheless their cost for the day will be about half what it would be if they choose to ski on trails requiring a pass. Some people may stay an extra day (more money for local businesses). The free trails are isolated from paid trails, so there is no risk of entering at a free trailhead and cheating. What can your business learn from the way Methow Trails uses Freemium pricing?

  • Understand the value customers derive from your products and services and set thresholds accordingly. For cross-country skiers, the value is in the experience from both the skiing and the location. You can only do a fraction of everything possible in the Methow Valley without paying. Some skiers may be satisfied with just the free trails, but most of the people making the trip won’t fall into this category. Still, if not enough people pay for the premium version of your product you might be in trouble (especially if you don’t properly understand cost). Methow Valley Trails knows their users through conducting surveys.
  • Free for the consumer doesn’t mean free for the supplier. That’s obvious for the Methow Valley where grooming and keeping snow parks clear use human and physical resources. Sometimes companies fool themselves by not accounting properly for the costs of providing a free version (perhaps thinking that they are providing the paid version anyway so it’s not worth worrying about the cost of the free version). For example, your cloud service might charge based on bandwidth; it might be expensive to support users of the free version.
  • Know your goals. Does the free version of your product lower the perceived value of the paid version? As our post on Van Westendorp pricing analysis shows, people understand the value of paying. Don’t be fooled into thinking that more users necessarily means increased success. If your profitability go down your organization might not be able to fulfill its mission – even if profit isn’t the main object as in the case of the Methow Valley Sports Trail Association which wants to connect people to the world-class trails (which means balance). Would you be better off making your app free (to market your products and services) rather than trying to trying to make money from a premium version? The free app for the MVSTA may not be as good as a physical map in many ways, but the trail grooming report and directions can be very helpful.

Snowshoe passes. The Methow Valley trail network includes many snowshoe trails. I’m not much of a snowshoer (there are usually more than enough cross country skiing opportunities for me), so my observations may not be totally accurate. Snowshoe trails require less grooming than cross country ski trails (I’d characterize it more as trail maintenance than grooming – particularly for trails used solely for snowshoeing), so $5 for a day pass seems like a fair price to me.

Trails for dogs.
cross-country skiing with dog in the Methow ValleyThere aren’t all that many opportunities to ski on groomed trails with your canine companion in Washington State so it’s great that the Methow Valley has included dogs in their trail system. Some of the trails that allow dogs are in the more remote areas or combined ski/snowshoe/dog trails that might not be groomed as often, but a couple of trails in the free areas allow dogs too. Daily passes for dogs are $10.


Fat-tire biking.Fat Bike in Methow ValleyFat-tire biking was introduced to the Methow Valley a few years ago, with trails and rental bikes so you can float on the snow instead of sinking as you would with a standard mountain bike. The mountain bikers in the party can appreciate a new experience if they haven’t tried fat-tire biking before, and it may appeal to others who perhaps aren’t enjoying cross-country skiing as much. Daily passes for Fat Tire bikes are $10.

Keeping up with the times. Both fat-tire biking and permitting dogs to accompany their people are examples of moving with the times. Most recently, adaptive skis have been made available for those with limited mobility. It used to be possible to buy season passes only at retail outlets, but now they are available online. Even though cross-country skiing has been around for thousands of years, the Methow Valley trails are continuing to expand their services to fulfill their mission.

Season pass variants. In addition to the regular season passes noted above, Methow Valley offers a weekday only season pass for $199, presumably targeted at residents. Season passes for dogs are $50, the same price as for snowshoes and fat-tire bikes.

I hope the examples and explanations in this post will give you some ideas about pricing for your own products and services. While I don’t advocate being too much in business mode when you are supposed to be relaxing, don’t forget that there are numerous opportunities to gain insights about business challenges from other situations. A different perspective can be extremely helpful. How do you think users of the Methow Valley cross-country ski trails system view pricing? What analogies work for your company?

You can find out more about winter sports in the Methow Valley at http://www.methowtrails.org/ . You can also cheer for two Nordic Skiing Winter Olympians from the Pacific Northwest who are based in the Methow Valley – sister and brother Sadie and Erik Bjornsen. http://nwnewsnetwork.org/post/pacific-northwest-olympians-2018-pyeongchang-winter-games

Sadie Bjornsen powers through the opening sprint of the Ski Tour Canada stage race. (Reese Brown)

Pricing Guru Mike (Mike Pritchard)
P.S. I haven’t noticed many locals turning up their noses at mispronunciation, but they appreciate it if you pronounce the name of their home as the “Met” “How” Valley.

Image of Sadie Bjornsen from NW News Network. Other images from Methow Trails.

Filed Under: Featured Posts, Pricing

This survey Hertz: lack of thought

I recently took a survey sponsored by the Hertz Corporation, intended to assess the appeal of several new approaches to services. This post discusses some of the problems I found, and why you should avoid creating your surveys like this one.

After asking about the number of times I had rented a vehicle, for what purpose, what type, and from which company, they asked how important price was to me when deciding which company to rent from the last time.

This is a pretty good question.PriceFactor2

Now they have an anchor for later questions about price. They know how important price was to me for this last rental. Note that the importance of price (or any other factor come to that) is situational, certainly for me. The last car I rented prior to taking the survey was for a vacation on Maui for a family wedding. I didn’t want a fancy car, or at least I didn’t feel like justify one for this trip – the wedding and all the fun things to do on Maui were going to be pretty expensive, and I expected to be driving on some substandard roads. I needed something flexible enough to take other members of the party – I expected people to be juggling activities. So I chose a four-door.

The next section of the survey covered the importance of various features, the mileage, and the condition of the vehicle. One question asked about the importance of general areas such as performance, cleanliness, audio features, fuel efficiency.
FeaturesImportance2

Most of the question options made sense to me, but mileage on the vehicle doesn’t seem like something that should be included in the list. From my perspective, the mileage is going to relate to the physical condition and the cleanliness of the vehicle. When I pick up the rental car the current mileage is just a minor item, and perhaps something to note for the contract, especially if there is a mileage limit on my rental. Perhaps I should be paying more attention, but I don’t remember ever thinking about it as I signed a contract. Perhaps somebody pointed out that this was a low mileage vehicle – I don’t remember. I guess I always expect a fairly low mileage on a rental car, especially from one of the major companies. Anyway, I wasn’t too surprised when I saw the first question that included the importance of mileage, although it struck me as a little odd in the same way I’m describing here. The next question asked me to rank the top three options of the nine that were provided previously; this still made sense.

Things went downhill from here. The next question asked the maximum number of miles of a rental car that I would find acceptable and still be satisfied. Here’s the question:
AcceptableMileage
Puzzled as I was by the notion that I could come up with an answer (note that the question text stresses “realistic”), I tried to enter “I don’t know” into the box in the forlorn hope that it would be accepted, despite the fact that the instructions read – please enter a whole number. My attempt generated an error message, repeating the directive, this time in bold red – Please specify a whole number. There was also a red warning at the top of the screen telling me that I needed to follow the instructions. These validation messages weren’t too surprising, but I was disappointed to find that I couldn’t indicate my real feelings. I next tried to enter “0” into the box. This generated a different error message – Sorry, but the value must be at least 100. I think this was the point at which I realized that this survey was going to provide material for an article. Expecting further fun and games, I decided not to waste too much more time on this one question. I entered 10,000 and was allowed to proceed to the next question.

Lesson 1. What’s the worst thing about this little battle with the question? The data they got from me is rubbish. If enough other people are equally uncaring, or like me have no realistic idea of the mileage that would be satisfactory, Hertz is making decisions on a very shaky foundation. Read on, it gets worse.

The introduction to the next section describes what I’ll see next – “…several scenarios – understanding your opinion when renting a vehicle. Please think about what makes a car rental experience enjoyable.” This sounded pretty good, but it turned out that they just wanted to torture me on the mileage issue in a different way.
$270_60000
“Uh oh”, went through my mind. “I wonder how they’ll play this out? Are we going to be negotiating on the mileage?” Yes that’s exactly what happened. I responded “Not very acceptable” to the first round of this question. I don’t really know whether it’s acceptable or not, but I’m pretty sure Hertz wants me to believe that it isn’t. I was actually hoping that I would just get a single question on the subject, but that’s not how it worked. The next question was exactly the same wording except that “had more than 60,000 miles on it” was replaced by “had 50,000 miles on it”. There was an additional instruction too – Please note that the question remains the same, but the NUMBER OF MILES ABOVE has changed. Isn’t there some form of torture based on telling the victim what’s going to happen? But now I’m curious and I want to see how long this can go on. 60,000, 50,000, 40,000, 35,000, 25,000, 20,000, 15,000, 10,000. I answered “Not very acceptable” every time. At 5,000 – yes, that’s the ninth repeat – I chose “Somewhat acceptable” and was allowed to move on to the next torture chamber.

Lesson 2. Why doesn’t this repetitive approach work? For one thing, it’s boring. Even if someone has a realistic idea of a good number (perhaps a rental car should be similarly low mileage to the vehicle at home that’s replaced regularly), they still have to go through the performance to reach the acceptable number. And it’s a negotiation – “how low mileage can I get for the same $270?” This is where annoyance and fatigue is going to build up. Bad data, increased likelihood of dropping out, reducing the likelihood of achieving representative results.

Idiosyncratically,

Mike Pritchard


Filed Under: Methodology, Pricing, Surveys

Valentine’s Day: think about seasonality and annual trends

Valentine’s Day provides an opportunity for me to suggest that your market research should take into account some bigger picture factors. Whether or not you have a retail product or service, there are lessons to be learned from Valentine’s Day. What are the annual seasonal variations in your business and what are the trends over longer periods? How do trends affect your market research?

256px-Chocolate_gift GVBORI_Diamond_ring_Heart_desgin256 RED_ROSES_4_(2791762442)

Valentine’s Day is well known as the second most important gift giving occasion in the calendar, in the US certainly and for most of the Western world also. But that’s too simplistic. Let’s look at trends of 3 important gift categories. I’m using Google trends to look at search volumes, as an easy way to make a couple of points.

[trends h=”330″ w=”500″ q=”flowers,+chocolate,+jewelry” geo=”US” date=”1/2008+73m”]
The Y axis is the volume of searches, and the X axis is time. We’re concentrating on searching here. [Data from various sources including the National Retail Federation show that flowers are given as gifts about twice as often as jewelry, and candy is more frequently given than flowers.]

Note that Christmas is more important than Valentine’s Day for searches on chocolate. And the same is true of jewelry. Flowers are rarely searched at Christmas, more frequently at Valentine’s Day, but most often for Mother’s Day. Note that these charts are all for the US so the added complexity of different dates for Mother’s Day in different countries has been eliminated.

OK so this is about chocolate, jewelry and flowers – what does it mean for your product or service? Imagine that you are planning a research project to find out which items you should carry in a multiline store. Or that you want to know which services will be most popular. Your results might be thrown off if you conducted the research without factoring in seasonality. Valentine’s Day, and gift giving in general are pretty obvious. So are back to school, outdoor recreation, and many other time-driven factors that might affect your business and your research. What about B2B? You probably need to be aware of budgetary cycles and replacement planning. The point is awareness. Once you know that the factors exist, you can decide if you should adjust research timing (this is rarely realistic), or if you need to modify the survey in other ways such as identifying buying cycles or interest levels in the category, including adjusting the sampling approach. For example, if you’ve just purchased a new car you are more likely to give coherent answers about after-market accessories.

Longer-term trends are a little harder to see from the Google Trends chart because of the big swings each year. But it is clear that the search volume for chocolate has increased over the past few years.

Back to Valentine’s Day. Much of the published research covers expected spending and plans. I’m a planner, so I’m usually ready for the holiday. What about those last minute people who haven’t prepared, or if they think about it at all are expecting to buy some flowers on Valentine’s Day itself? With the severe weather conditions in the Northeast, these people might be out of luck, and their sweethearts will be disappointed. I hope they can order something online – the acknowledgment and an electronic greetings card might have to do.
512px-Cross_Country_Skiing_Belden_Ave_Chicago_Feb_2_2011

Idiosyncratically,

Mike Pritchard


Image sources:

Ring: By GVBORI520 (Own work) [CC-BY-SA-3.0 (http://creativecommons.org/licenses/by-sa/3.0)], via Wikimedia Commons
Chocolate: By Chrys Omori from Sao Paulo, Brazil (Mother’s birthday gift) [CC-BY-2.0 (http://creativecommons.org/licenses/by/2.0)], via Wikimedia Commons
Flowers: By Kaz Andrew from Edmonton,Alberta, Canada (RED ROSES 4 Uploaded by Dolovis) [CC-BY-SA-2.0 (http://creativecommons.org/licenses/by-sa/2.0)], via Wikimedia Commons
Snowy road: Victorgrigas at en.wikipedia [CC0], from Wikimedia Commons

Filed Under: Methodology, Statistics

  • Go to page 1
  • Go to page 2
  • Go to page 3
  • Interim pages omitted …
  • Go to page 6
  • Go to Next Page »

Primary Sidebar

Follow us on LinkedIn Subscribe to Blog via RSS Subscribe to Blog via Email
Many thanks to you for the very helpful presentation on pricing last night. I found it extremely useful and insightful. Well worth the drive down from Bellingham!
G.FarkasCEOTsuga Engineering
Every conversation with Mike gave me new insight and useful marketing ideas. 5 Circles’s report was invaluable in deciding on the viability of our new product idea.
Greg HowePresidentCD ROM Library, Inc.
When you work with a market research company you normally have to define the questions. 5 Circles Marketing’s staff have technical backgrounds, so it’s a lot easier to work with them.
Lorie WigleProduct Line Manager, Business Communications DivisionIntel Corporation
Mike did multiple focus groups for me when I was at Amazon, and I was extremely pleased with the results. Not only is Mike an excellent facilitator, he also really understood the business problem and the customer experience challenges, and that got us to excellent and very actionable results.
Werner KoepfSenior ManagerAmazon.com
You know how your mechanic knows what’s wrong with your car when you just tell them what it sounds like over the phone? Well, my first conversation with Mike was like that — in like 10 seconds, he gave me an insight into my market research that was something I’d been struggling trying to figure out. A class like this will help you learn what you can do on your own. And, you’ll have a better idea of what a research vendor can do for you.
Roy LebanFounder and CTOPuzzazz
Mike brings a tremendous balance of theoretical marketing research with a strong practical knowledge of marketing. He can tailor the research to the right level for your project. I have hired Mike multiple times and he has delivered each time. I would hire him again.
Rick DenkerPresidentPacket Plus
Since becoming our contracted consultant for market research services in 2010, 5 Circles Research has revolutionized our annual survey of consumer opinion in Washington. Through the restructuring of survey methodology and the application of new analytical tools, they have provided insights that are both wider in their scope and deeper in their relevance for understanding consumer values and behavior. As a result, the survey has increased its significance as a planning and evaluation tool for our entire state agency. 5 Circles does great work!
Blair ThompsonDirector of Consumer CommunicationsWashington Dairy Products Commission
What we were doing was offering not just a new product, but a new market niche. We needed to understand traditional markets well to characterize the new one. Most valuable was 5 Circles ability to gather research data and synthesize it.
Will NeuhauserPresident Chorus Systems Inc.
I hired Mike to develop, execute and report on a market research project involving a potential business opportunity. I was impressed with his ability to learn the industry and subsequently develop a framework for the market research project. He was able to execute the research and collect data efficiently and effectively. Throughout the project, he kept me abreast of the progress to allow for any adjustments as needed. The quality and quantitative output of the results exceeded my expectations and provided me with more confidence in the direction of the business opportunity.
Mike ClaudioVice President Marketing and Business DevelopmentWizard InternationalSeattle
Great workshop! You know this field cold, and it’s refreshing to see someone focused on research for entrepreneurs.
Maria RossOwnerRed Slice

Featured Posts

Dutch ovens: paying a lot more means better value

An article on Dutch ovens in the September/October 2018 of Cook’s Illustrated gives food for thought (pun intended) about the relationship of between price and value. Sometimes higher value for a buyer means paying a lot more money – good news for the seller too. Dutch ovens (also known as casseroles or cocottes) are multipurpose, [Read More]

Profiting from customer satisfaction and loyalty research

Business people generally believe that satisfying customers is a good thing, but they don’t necessarily understand the link between satisfaction and profits. [Read More]

Customer satisfaction: little things can make a big difference

Unfulfilled promises by the dealer and Toyota of America deepen customer satisfaction pothole. Toyota of America and my local dealer could learn a few simple lessons about vehicle and customer service. [Read More]

Are you pricing based on cost rather than value? Why?

At Pricing Gurus, we believe that value-based pricing allows companies to achieve higher profitability and a better competitive position. Some companies disagree with that perspective, or feel they are stuck with cost-based pricing. Let’s explore a few reasons why value-based pricing is generally superior. [Read More]

Recent Comments

  • Mike Pritchard on Van Westendorp pricing (the Price Sensitivity Meter)
  • Marshall on Van Westendorp pricing (the Price Sensitivity Meter)
  • Manik Balaam on Dutch ovens: paying a lot more means better value
  • 📕 E mail remains to be the most effective SaaS advertising channel; Chilly emails that work for B2B; Figuring out how it is best to worth… - hapidzfadli on Van Westendorp pricing (the Price Sensitivity Meter)
  • Soumyak on Van Westendorp pricing (the Price Sensitivity Meter)

Categories

  • Overview
  • Contact
  • Website problems or comments
Copyright © 1995 - 2025, 5 Circles Research, All Rights Reserved